Childhood Obesity Statistics
Childhood obesity statistics worldwide reveal a worrisome trend that has lead to policy makers, parents and caregivers rethinking how best to deal with this growing pandemic. By definition obesity can be simply understood as weight gain that results in serious threat to a person's health The height and weight of an individual is calculated to produce the body mass index (BMI) which is an important tool of diagnosing obesity. This essentially applies to adults.
Due to increasing childhood obesity prevalence experts are noticing emerging trends of a raise in the association between childhood obesity and diabetes. This is particularly the case as it pertains to type 2 diabetes which previously used to be highly associated with adults over the age of 40 in America. Studies done in America focused on producing credible childhood obesity statistics have shown that the past 30 years or so have given rise to a pediatric obesity rate of more than double.
Kids between the ages 2 and 5 have had a doubling of prevalence with those between ages 6 to 11 being hard hit with statistical data showing a tripling of prevalence over these 30 years. In the United States alone as many as 9 million over 6 kids are considered to be obese and this number is by no means stagnant but continues to grow each year. Obesity puts a greater number of children at high risk of developing certain chronic ailments such as heart disease, high blood pressure, diabetes and kidney disease. In fact cardiovascular disease has been identified as a real danger amongst 70 percent of children aged between 5 to 17 years.
Still in the United States childhood obesity statistics further indicate that nearly 200 000 kids under the age of 20 years already have type 1 or type 2 diabetes. These figures discounts the undiagnosed cases of diabetes. Statistical data by gender over a period of time focusing on boys shows a sharp rise in obesity between 2007 and 2008 greater than experienced between 1988 and 1994.
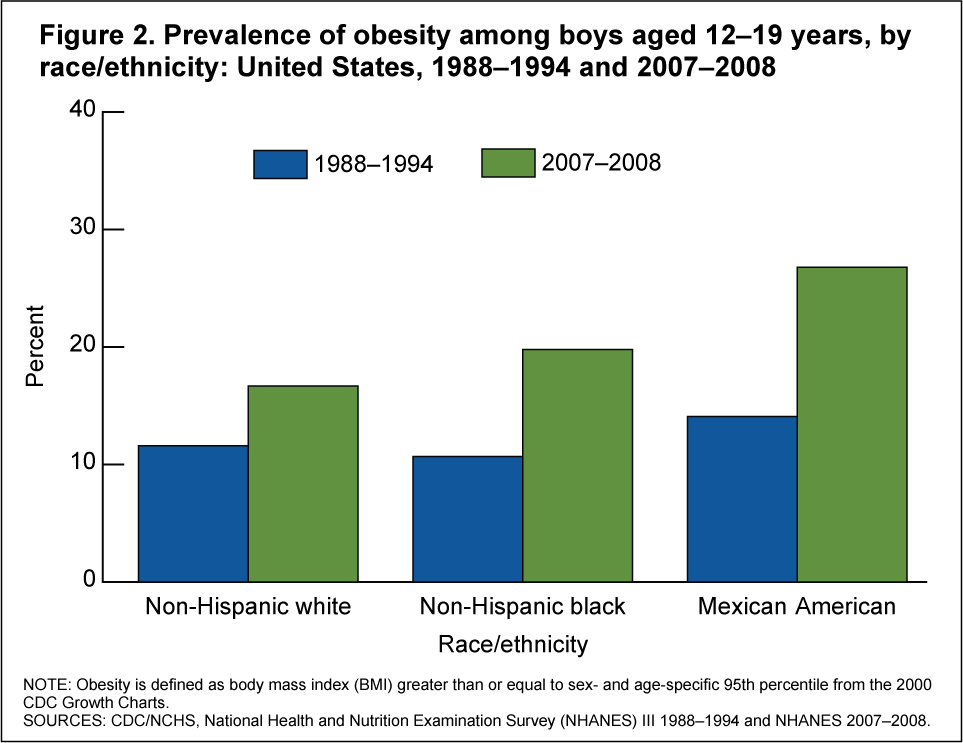
For example as shown above amongst young non-hispanic white boys aged 12 to 19 years old there was a prevalence of about 12 percent between 1988 to 1994 which jumped amongst the same group to over 15 percent between 2007 and 2008. By far pediatric obesity statistics from America shows that Mexican American boys had the highest prevalence of over 20 percent between 2007 and 2008.
Unique challenges have been faced whilst attempting to measure comparative childhood obesity data amongst kids 5 to 14 years old. This is due to a missing standardized definition of childhood obesity applicable across the globe. In the year 2005 the World Health Organization (WHO) estimated that at least 20 million children below the age of 5 were overweight or obese all across the world. This is in light of missing credible childhood obesity statistics from poorer countries where data collection is poor.
Type 2 diabetes is increasingly being associated with childhood obesity. Learn in detail about diabetic nutrition which is an important part of healthy eating.
Pediatric Obesity Statistics In England
 In England in 2005, 20 percent of 2 to 15 year old kids were considered obese. This is a massive jump from just above 10 percent in 1995. In 1999 the figure reached 15 percent before slightly dropping to about 14 percent in year 2000 and picking up again to about 17 to 18 percent in 2004. Studies also show that in England the average boy of 15 years of age weighed 60.7kgs in 2003. This was some points higher than the weight of the same boy in 1995 at 58.8kgs. During this same period an average girl of the same age almost remained the same in weight at 58.9kgs in 2003 compared to 58.5kgs in 1995.
Pediatric Obesity Statistics In Australia
 The challenges in Australia in as far as childhood obesity is concerned are just as mammoth as in the United States and many parts of the western world. Noticeable increase in Australian pediatric obesity statistics began in the 80s. This is the same time changes also started happening in America. The following is a summary of statistical data for childhood obesity in Australia;
1. About 1.5 millions under 18 kids in Australia are thought to be obese or at least overweight.
2. Up to 50 percent of all kids who are obese in childhood will remain obese as adolescents.
3. Over a ten year period comparison of boys and girls between ages 7 to 15, 4.7 percent of boys and 5.5 percent of girls were obese in 1995. 1.4 percent of of boys and 1.2 percent of girls were obese in 1985.
4. In year 2000 studies involving children between ages 7 to 11 showed that 26.2 percent of boys were obese and 28.4 percent of girls.
Pediatric Obesity Statistics In Canada
Just like the United States, Canada is also in the grips of a problematic growth in the number of obese kids. The Childhood Obesity Foundation states that there has been a tripling in the number of obese children in the past 25 years. Today as many as 25 percent of Canadian kids between 2 to 17 years old are either overweight or obese. The cost of obesity overall in Canada was estimated to be at $4.3 Billion in 2001
Childhood Obesity Statistics In South Africa
South Africa is a developing country with relatively good data collection on childhood obesity. In South Africa statistical data shows that nearly 20 percent of children aged between 6 to 11 old are obese. Of those between 12 and 19 years of age up to 18 percent are obese.
In light of all this childhood obesity statistics experts, parents and policy formulators are ever worried about the short term and long term negative consequences of obesity in children. There are known specific psychological effects of overweight such as depression which in itself can fuel over eating. Low self esteem especially amongst female kids, behavioral and learning problems which might affect school performance are some of the long term effects of obesity to expect.